
 Electrocardiography is a fundamental part of cardiovascular assessment. It is an essential tool for investigating cardiac arrhythmias and ischemia. Just because electrocardiography is a basic skill in EM doesn’t mean that our skills should be basic…we must be the EXPERTS! Below is a summary of some ECG basics including:
- ECG Measurements
- ECG Rate
- ECG Axis
ECG Measurements
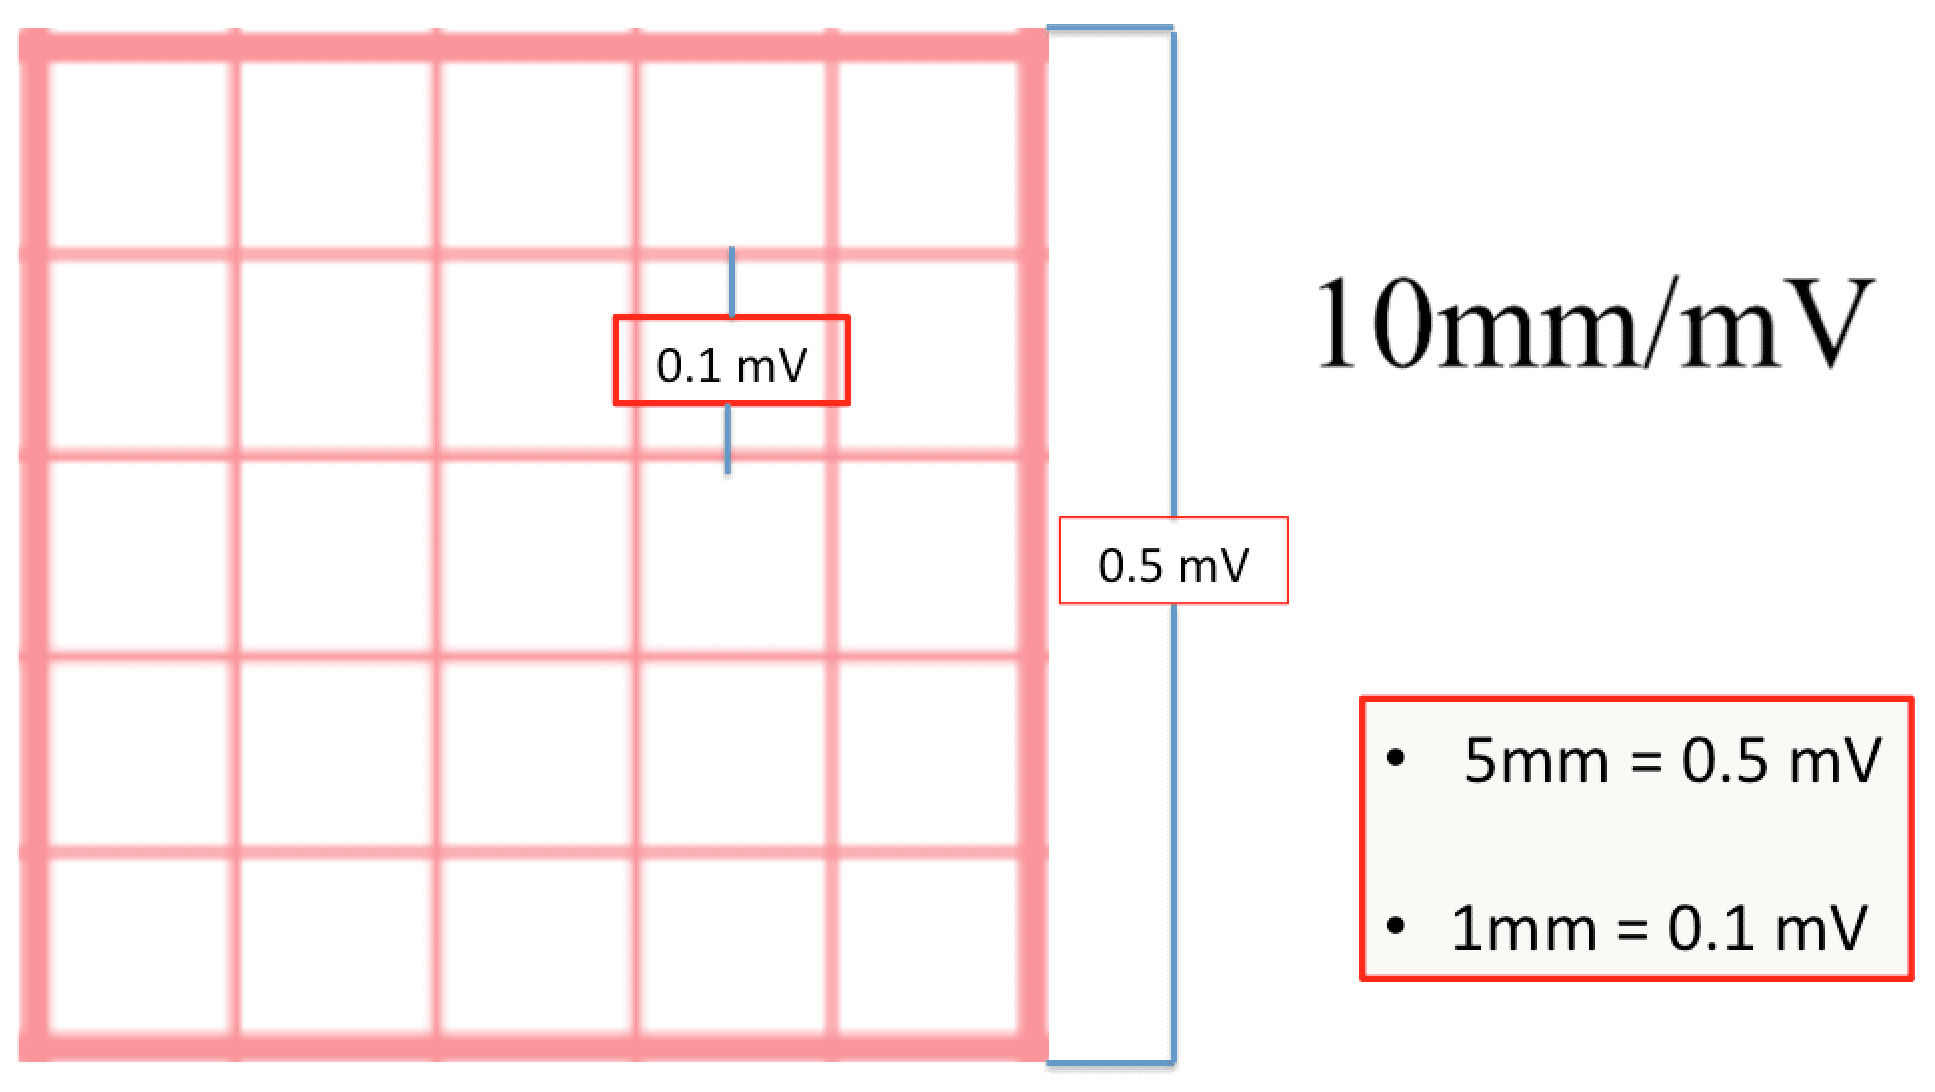
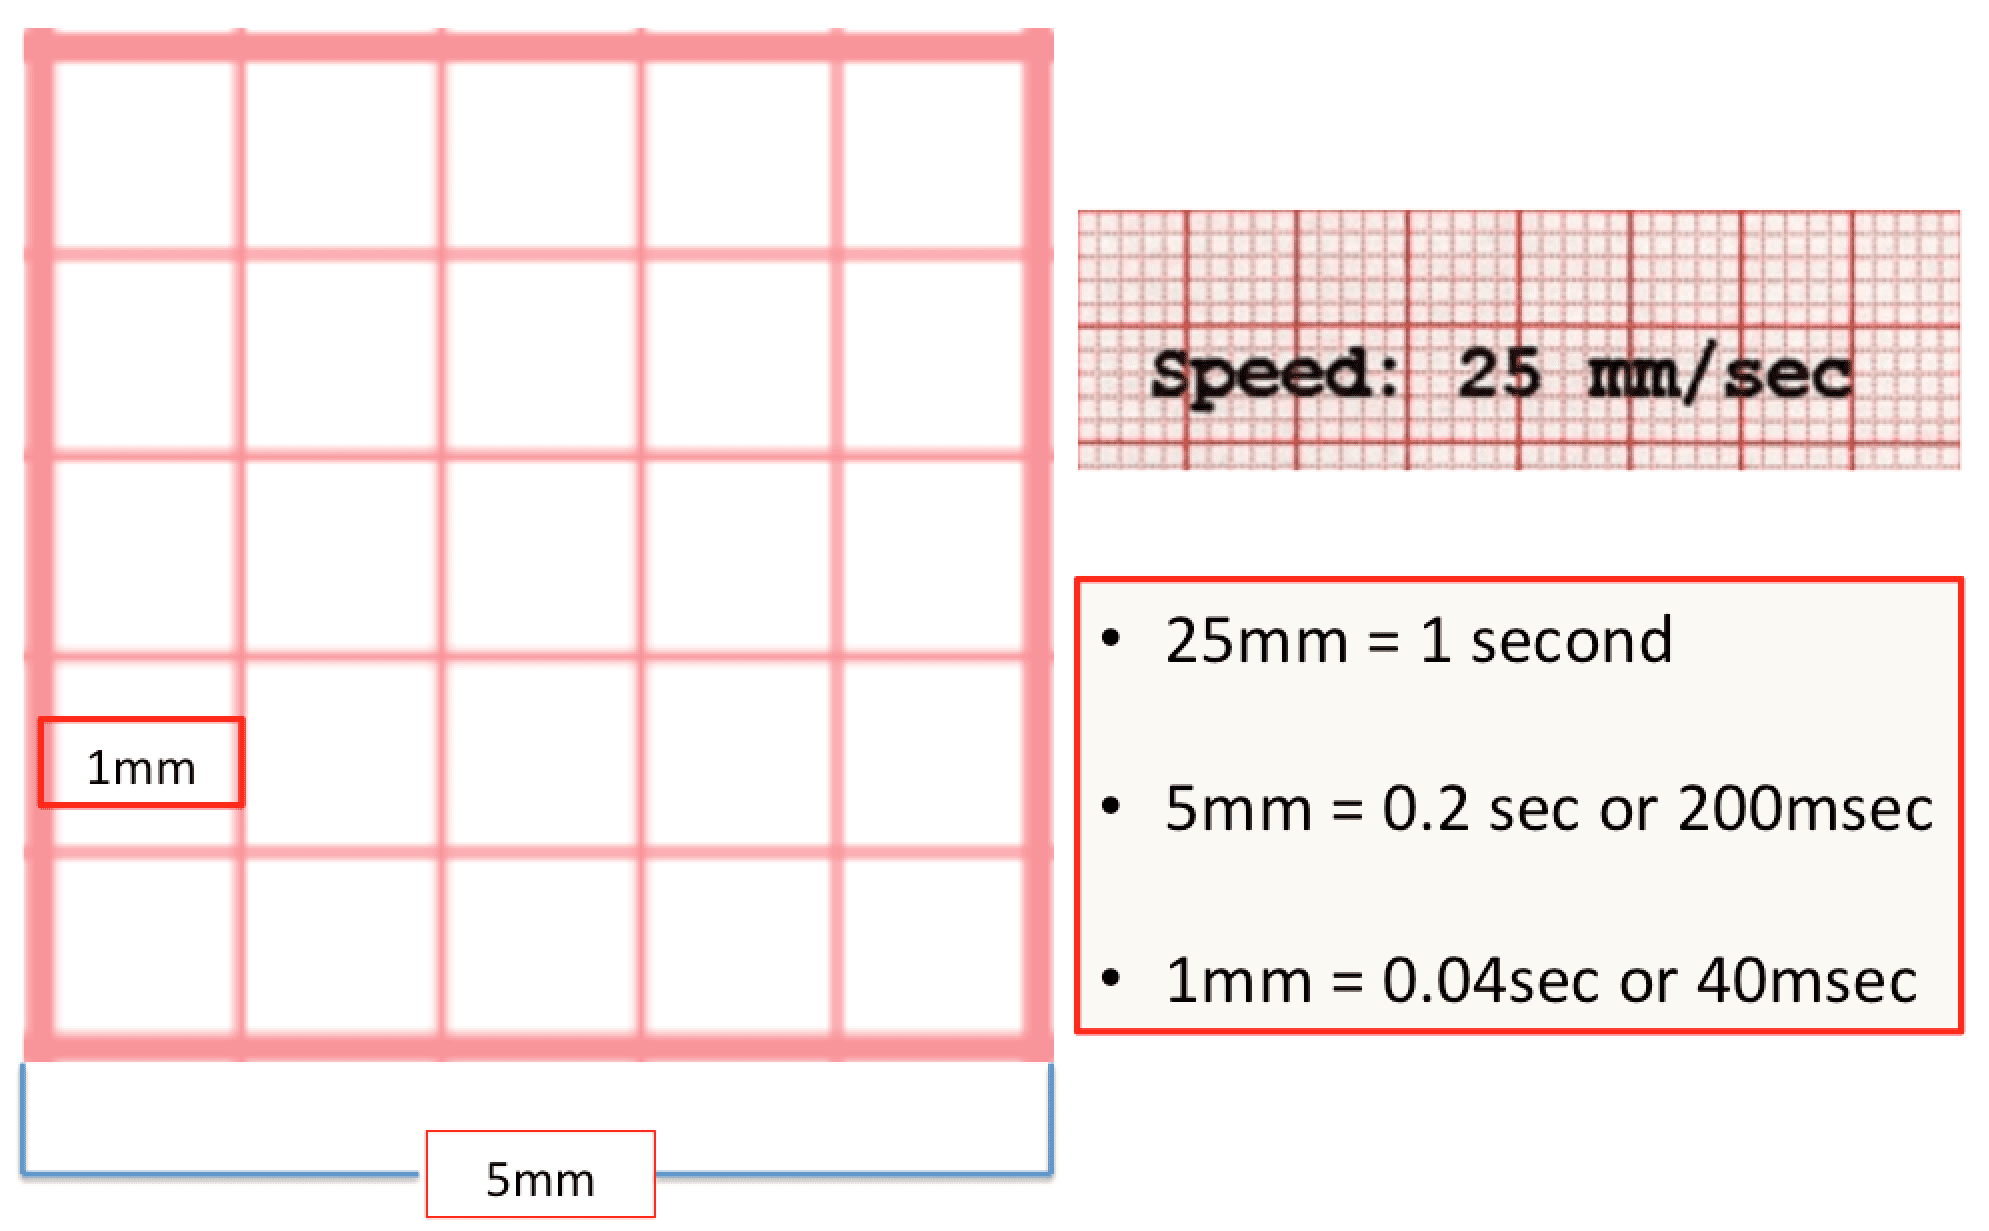
For the purpose of this post, the duration of waveforms will be expressed as 0.04 sec (40 msec) = 1mm = 1 small square and the amplitude of waveforms will be expressed as 0.1 mV = 1mm = 1 small square.
ECG Rate

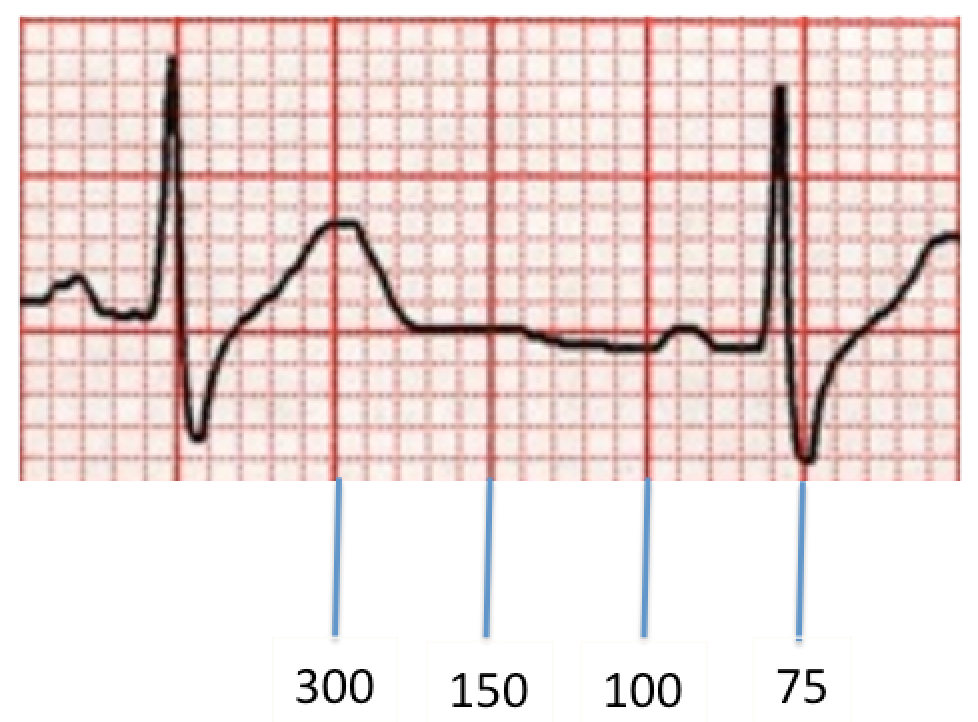
1. The Cardiac Ruler or Sequence Method: Count the number of big boxes between R waves and count using the following numbers: 300-150-100-75-60-50. This can only be used on regular rhythms and not on irregular rhythms
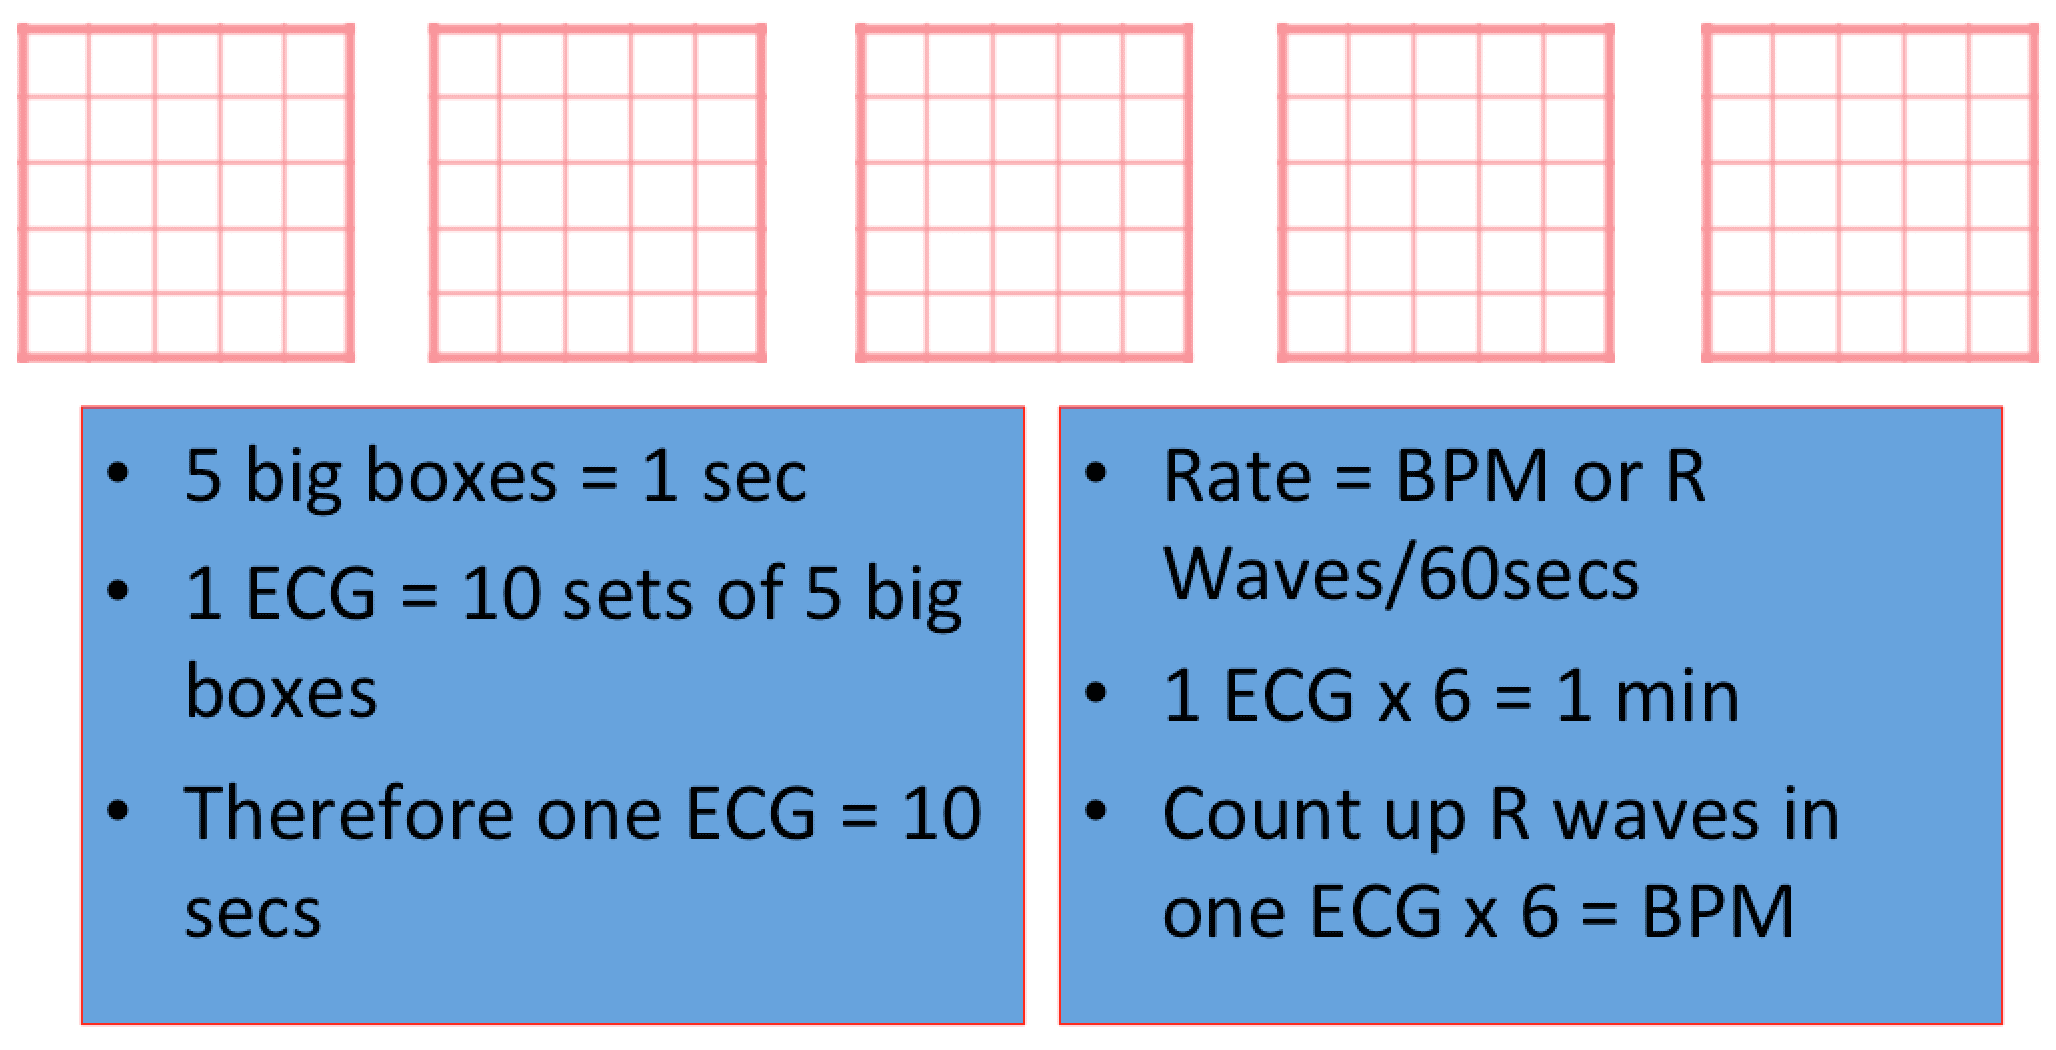
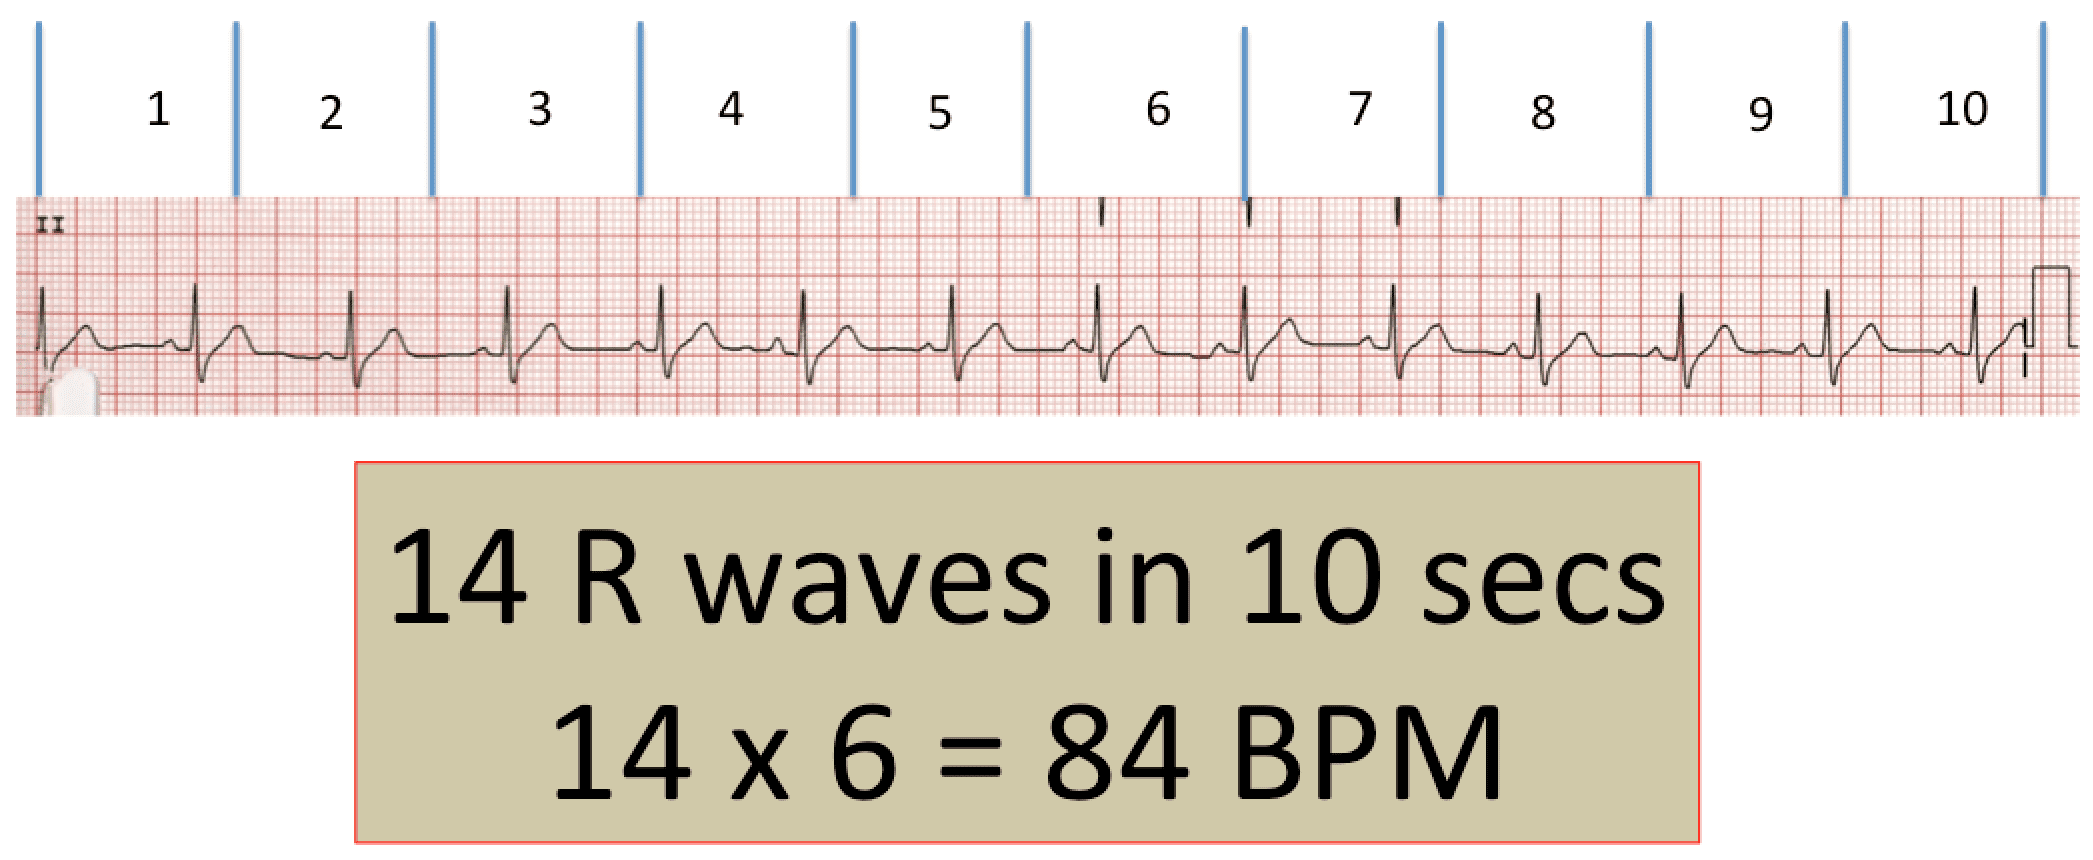
2. The Six Second Method: Get 6 seconds of ECG tracing (i.e. 30 big boxes) and count the number of R waves that appear within that 6 second period and multiply by 10. Another version of this is the 10 second method (i.e. 50 big boxes) and count the number of R waves that appear within that 10 second period and multiply by 6. This is a great method for slow or irregular rhythms
3. The 300 Method: Count the number of large boxes between 2 successive R waves and divide by 300 to obtain heart rate.
4. The 1500 Method: Count the number of small boxes between two successive R waves and divide this number into 1500 to obtain heart rate. This works well for faster heart rates.
ECG Axis

The definition of axis is an average of all electrical signals from the heart, indicating the average direction of electrical depolarization. To determine the heart axis you look at the extremity leads only (not V1-V6).
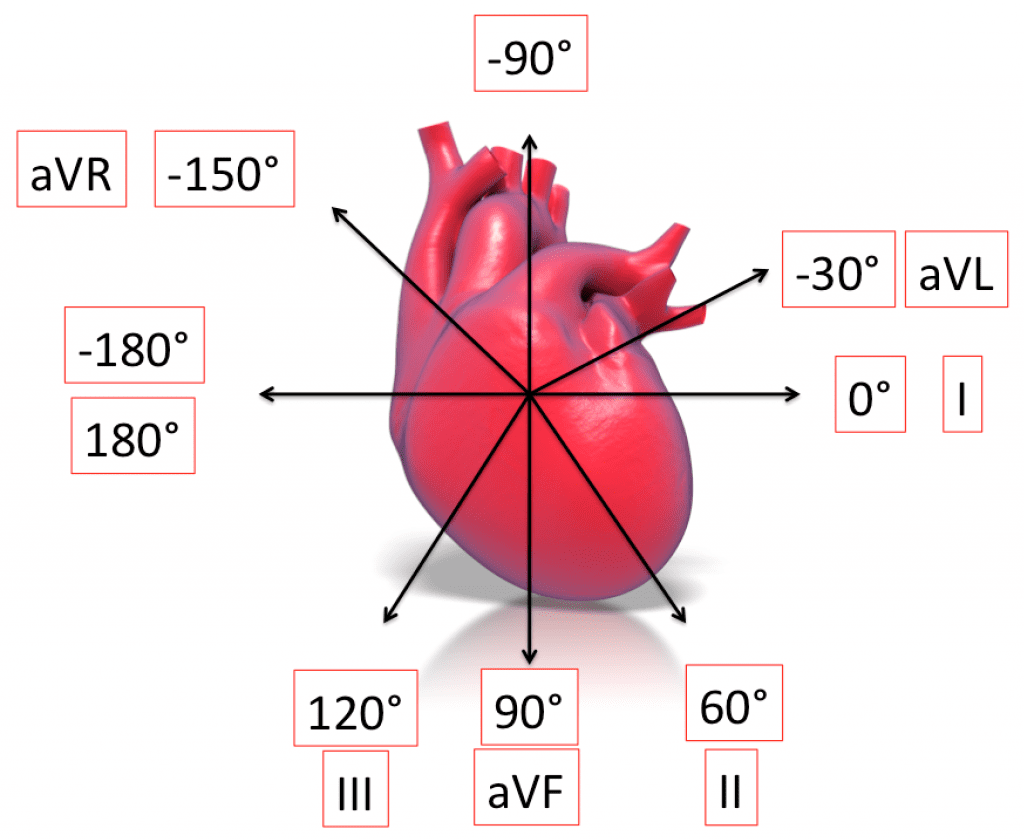
- Normal Axis = -30 to 90 degrees
- Left Axis Deviation (LAD) = -30 to -90 degrees
- Right Axis Deviation (RAD) = 90 t0 180 degrees
- Extreme Axis = -90 to -180 degrees
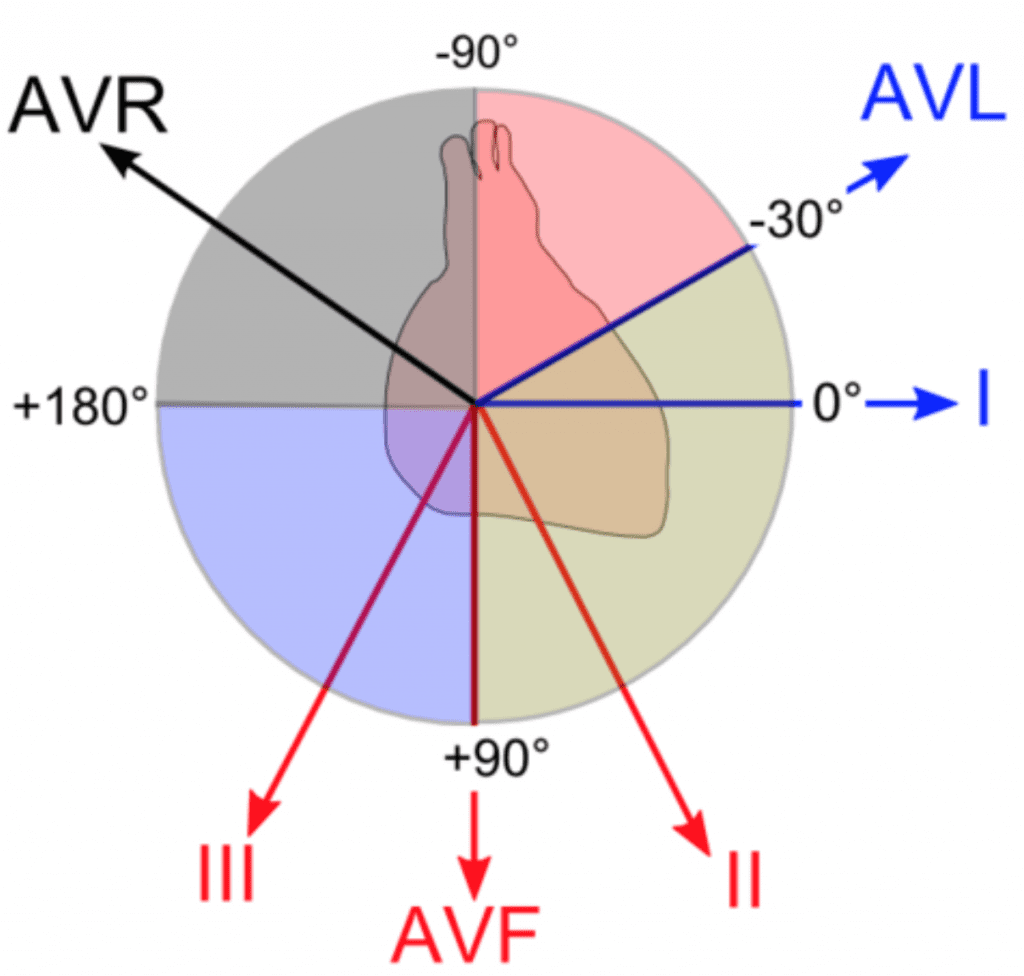
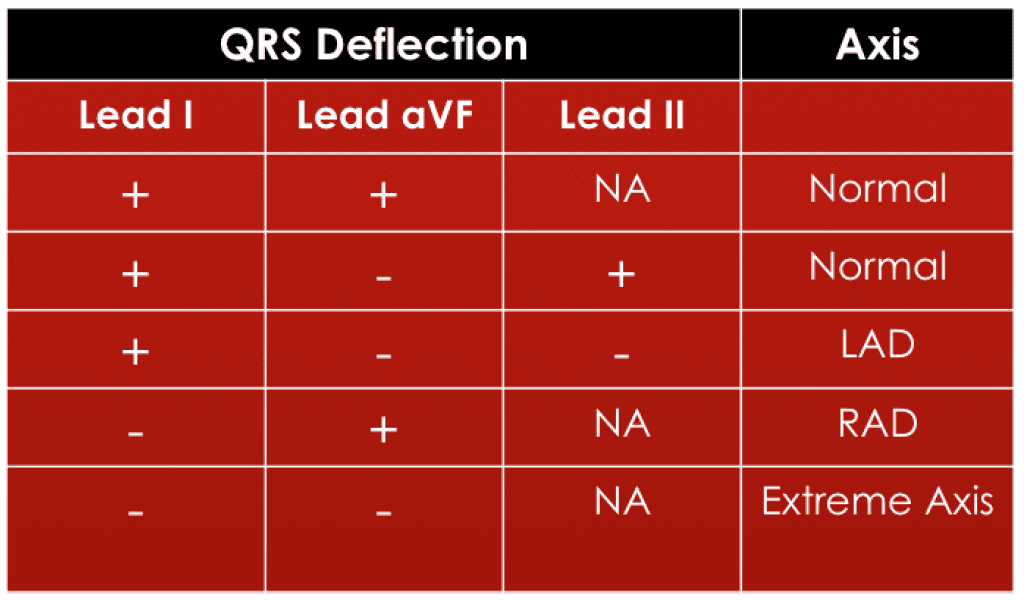
A simple way to look at this is to look at the main direction of your QRS in leads I and aVF. Lead I represents a left sided lead and lead aVF represents a right sided lead. You can use a quick look test to guestimate your axis.
Quick Look Test
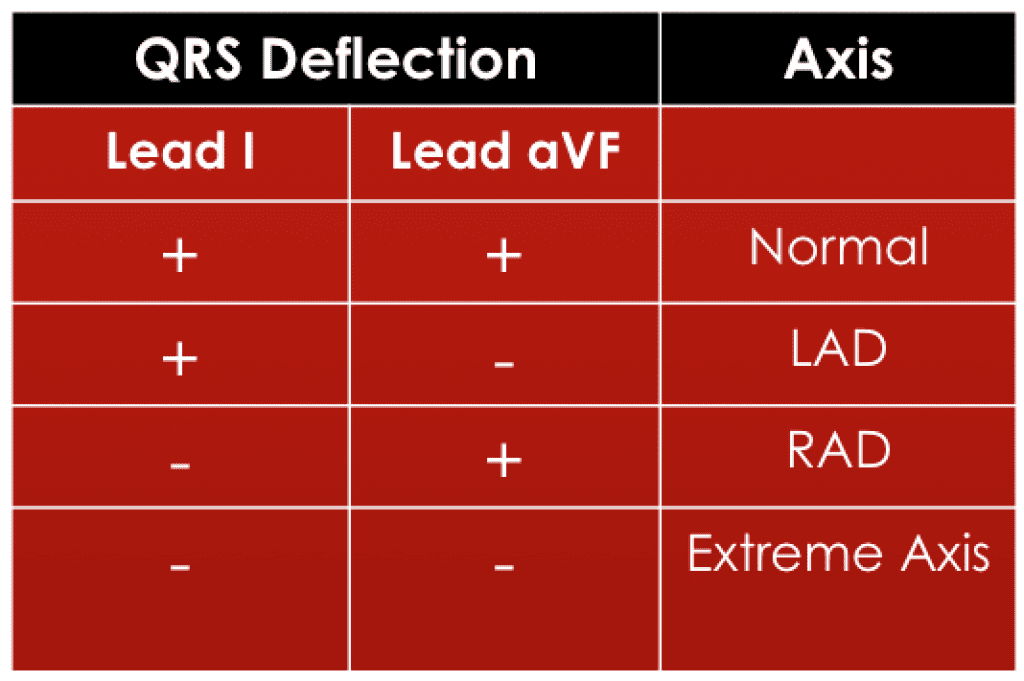
In reality though, normal axis is -30 to 90 degrees not 0 to 90 degrees. The easiest way to account for this is if your QRS vector is up in lead I and down in aVF, then next look at lead II. This lead is exactly 90 degrees from lead aVL. If the QRS vector is up in II then you have a normal axis. If the QRS is down in lead II, then you have LAD. This is represented in the table below.
The electrocardiogram is one of the simplest and basic cardiac investigations available. It can provide a wealth of useful information, and remains an essential part of the assessment of patients. After reading this post, you should be comfortable with ECG measurements, rate, and axis. There is much more to reading ECGs, but hopefully this is a good start to some ECG Basics.
The post ECG Basics appeared first on REBEL EM - Emergency Medicine Blog.
